Real examples of Graphviz
This week we wanted to highlight Graphviz.

What are main reasons to use Graphviz/DOT:
diagrams as code
- easy to review in pull requests.
- can be embed in your documentation. Supported by sphinx and many others.
- track the history of changes
- very simple and intuitive DSL to create by hands
very easy to create programmatically
- helper libraries in most of the programming languages (python, javascript, ruby, java you name it)
- DSL is so easy, so you don’t even need a library to create it in your script.
In this article I will show several use cases I personally use Graphviz for.
Business Process Diagram
Business process diagram (or BPMN) is a diagram describing business process.
If you are working with DDD (domain driven design) or work with enterprise software you probably read or even write them regularly
Example:
digraph BPMN {
  rankdir=LR;
  node[shape=rectanble style="rounded,filled" color="lightgoldenrodyellow" ]
  start[shape=circle color=palegreen1]
  end[shape=doublecircle color=orangered]
  join, join2[shape=diamond label="" style="filled" fillcolor=orange]
  wait, delay[shape=circle color="lightgoldenrod1"]
  start -> announce
  announce -> delay
  announce -> moderate
  moderate -> join2
  delay -> email
  email->join2
  check_cal[label="check\ncalendar"]
  announce -> check_cal
  conf_call[label="conference\ncall"]
  check_cal -> conf_call
  conf_call -> wait[label=yes]
  moderate_conf[label="moderate \nconference call"]
  wait -> moderate_conf
  moderate_conf -> join
  conf_call -> join[label=no]
  join->join2
  join2->evaluate
  evaluate->end
}
(you can play with business process example here)
Microservices Interaction
When you operate in a microservice environment sometimes you need to visualize what’s going on.
There are some sub-types of the interactions you care about.
- general picture of the service dependencies. With thousands of service running in production sometimes it’s hard to understand the dependencies between them. Visual picture is great for that.
- you can overlay number of requests on top of #1 above, so you see fanout and how traffic is distributed to microservices.
- visualizing specific request aka trace. If you use distributed tracing then you might have some built-in solution for this. If you can create your own and visualize it.
- add latencies on top of a single trace or p50/p90/p99 on top of aggregate graph.
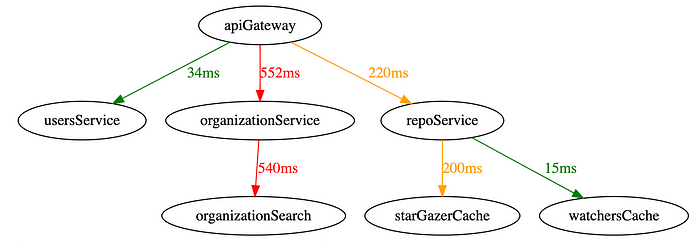
Here is an example graph with latencies displayed:
digraph ServiceInteraction {
    apiGateway -> usersService[color=green label="34ms" fontcolor="green"]
    apiGateway -> organizationService[color=red label="552ms" fontcolor="red"]
    organizationService->organizationSearch[color=red label="540ms" fontcolor="red"]
    apiGateway -> repoService[color=orange label="220ms" fontcolor="orange"]
    repoService -> starGazerCache[color=orange label="200ms" fontcolor="orange"]
    repoService -> watchersCache[color=green label="15ms" fontcolor="green"]
}
(you can play with Microservice Interaction example here)
Software Architecture Diagram
You are probably using LucidChart, Vizio, Google Docs shapes or similar when creating your design documents or RFCs.
Why it’s better to use Graphviz?
- have diagrams in your code review / pull request.
- check in and modify designs during implementation phase to keep design close to implemnentation.
- collaborate on design with your colleagues.
Example architecture diagram:
digraph MessageArchitecture {
  messageClient
  messageQueue[shape=rarrow]
  messageBackend[shape=rectanble]
  messageDB[shape=cylinder]
  userService[shape=rectangle]
  userDB[shape=cylinder]
  pushNotifications[shape=octagon]
  messageNotifier[shape=rectangle]

  messageClient -> messageBackend[label=sendMessage]
  messageBackend -> userService
  userService -> userDB
  messageBackend -> messageDB
  messageDB -> messageQueue[label="change data captrure"]
  messageQueue -> messageNotifier
  messageNotifier -> pushNotifications
}
(you can play with Architecture Diagram example here)
Workflow Diagram
There are multiple workflow systems available (Amazon SWF, Amazon Step functions, Netflix conductor, Uber Cadence, Camunda etc).
Some of them come with their own visualization tools and some don’t.
Many reasons why you might want to build Graphviz representation for your Workflow Diagrams:
- check-in with your documentation.
- sketch it before implementing at design phase
- regenerate it from your workflow code; then this can be peer-reviewed at pull request. sometimes it isn’t obvious what’s changed in your workflow until you see it visually.
- visualize particular workflow execution or aggregate across all instance of a workflow.
Example workflow graph:
digraph BookingWorkflow {
  start[shape=circle]
  end[shape=doublecircle]
  lock_booking[shape=rectangle]
  process_payment[shape=rectangle]
  successful_payment[shape=diamond label="success?"]
  reserve_booking[shape=rectangle]
  release_booking[shape=rectangle]

  start -> lock_booking
  lock_booking -> process_payment
  process_payment -> successful_payment
  successful_payment -> release_booking[label=NO]
  successful_payment -> reserve_booking[label=Yes]
  reserve_booking -> send_email
  send_email -> end
  release_booking -> end
}
(you can play with Workflow Diagram example here)
Entity Relationship Diagram
Where do you need ERD?
- During design phase to show your entities and relationships between them
- Visually see existing entities (from your DB tables)
Visually see the entities and relationships between them can be invaluable especially in your documentation or designs.
Representing it as code (GraphViz/DOT) is great because:
- it can be checked into your documentation, code reviewed.
- auto-generated from your DB or RPC schema.
There are some open source projects already that help you to build ERD diagrams from protobuf. Most of the DB clients allow you to build visual ERD from DB schema.
Example ERD represented in GraphViz:
digraph GitHub {
    graph [
        rankdir = "LR"
    ];
    node[shape = record];
    organization[label="Organization | { url | string } | {id | int} "]
    user[label="User | {avatar|string} | {email|string}"]
    repository[label="Repository | {name|string} | {stargazers_count|int}"]
    repository -> user[label=stargazers taillabel=1 headlabel=N dir=both]
    organization -> repository[label=repos taillabel=1 headlabel=N]
    organization -> user[label=members taillabel=1 headlabel=N]
}
(you can play with ERD example here)
This article was originally published in DevToolsDaily blog


